

Introduction: Why This Methodology Guide Exists
When you read my hosting reviews—whether it’s InMotion Hosting, Verpex Hosting, or InterServer Hosting—you’ll see specific performance numbers:
“GTmetrix showed 517ms LCP with Grade A performance”
“PageSpeed Insights scored 97/100 on desktop”
“Pingdom reported a 91 performance grade”
“UptimeRobot monitored 99.97% uptime over 27 days”
But here’s the truth I’ve learned after testing different type of hosting plans: Most readers don’t just want the results—they want to understand HOW I got them.
They may ask me:
- “What GTmetrix settings do you actually use?”
- “How do you avoid testing bias and cherry-picking results?”
- “Why do different tools show completely different speeds?”
- “How do you ensure fair comparisons between different hosts?”
This guide answers all of that. I’m going to walk you through my exact testing methodology—the four tools I use, the specific settings I configure, the three-phase testing process I follow, and the quality standards I maintain. By the end, you’ll understand not just my results, but why they are reliable and reproducible.
Why Testing Methodology Matters (More Than You Think)
Here’s a hard truth that separates trustworthy reviews from marketing fluff: Poor methodology leads to unreliable data.
A hosting provider might look blazingly fast when you test under perfect conditions—but perform terribly under real-world load. Or a testing tool might show inflated numbers because of caching tricks or optimal timing that regular users never experience.
My methodology exists to eliminate that noise and bias. It’s designed to:
✅ Test consistently – I use the same approach for every single host
✅ Avoid bias – No optimizations that real users won’t see in production
✅ Replicate reality – Test conditions match typical WordPress site setups
✅ Catch problems early – Extended 27-day monitoring catches issues that quick tests miss
✅ Provide transparency – You know exactly what I tested and how
When you choose a hosting provider based on my reviews, you’re not just trusting my opinion—you’re trusting a rigorous, documented process that you can verify yourself.
The Four Tools I Use (And Why Each Matters)
I use four primary tools for testing, each serving a distinct purpose and measuring different aspects of hosting performance.
Tool 1: GTmetrix (Primary Performance Testing)
Why I use it: GTmetrix is my go-to tool because it’s consistent, detailed, and focuses specifically on Core Web Vitals—the metrics that actually affect user experience and SEO rankings.
What it measures:
- LCP (Largest Contentful Paint) – How long until your main content appears on screen
- TBT (Total Blocking Time) — How long the page feels “stuck” or “frozen” even though it looks finished.
- CLS (Cumulative Layout Shift) – Visual stability (does the page jump around while loading?)
- Performance Grade – Overall score from 0-100
- Structure Grade – Code quality assessment
My exact settings:
- Test location: Default test server location selected by GTmetrix
- Browser: Chrome (latest version)
- Connection: Unthrottled (simulates modern broadband, not slow mobile)
- Device: Desktop (primary way people research hosting)
- Test runs: 3–5 tests per host (I average the results)
- Time between tests: Minimum 2 hours apart
- Cache: Cleared before each test
Why these settings matter:
- Using the tool’s default location removes manual tweaking and keeps tests simple and repeatable for anyone following this guide.
- Unthrottled connection reflects reality for most readers, who browse on broadband or fiber, not 3G.
- Desktop focus matches how most people compare hosts and manage their sites (full dashboards, editors, analytics).
- Running multiple tests and averaging the results smooths out random network spikes and gives a more stable picture of real performance.
- Clearing cache before every test ensures I’m measuring server performance, not your browser’s stored files.
What I look for:
- LCP < 1 second = Excellent (feels instant to users)
- LCP 1–2 seconds = Good (acceptable, but room for improvement)
- LCP > 2.5 seconds = Poor (noticeably slow, will impact user experience)
Common mistakes I avoid:
- Testing only once (one test can be skewed by temporary network issues)
- Testing with cache enabled (gives artificially fast results)
- Using heavily throttled settings by default (unrealistic for most readers)
- Changing locations between tests (makes results harder to compare over time)
Tool 2 — Google PageSpeed Insights (Lab testing & SEO signal)
Why I use it :
PageSpeed Insights shows the metrics Google cares about. For brand-new test sites (not indexed, no real visitors) PageSpeed’s Lab Data is the useful baseline — it’s a reproducible, controlled simulation of page loading behavior. Field Data (real user data) will not be available for fresh test sites because they aren’t indexed and don’t yet receive real traffic.
What PageSpeed shows (key parameters I record)
- Performance Score — overall page speed (0–100).
- LCP (Largest Contentful Paint) — when the main content becomes visible.
- TBT (Total Blocking Time) — how long the page is blocked from responding during loading (used here instead of INP).
- CLS (Cumulative Layout Shift) — visual stability while the page loads.
- Lab Data vs Field Data — Lab = synthetic, controlled test I use; Field = real visitors (absent for non-indexed test sites).
My exact PageSpeed settings
- Test both: Desktop and Mobile.
- Cache: Cleared before every test.
- Runs: 3 tests per site; I average the results.
- Focus: Lab Data (because Field Data is unavailable on new test sites).
- Note: When Field Data finally appears for a live, indexed site, I compare it with the lab numbers — they complement each other.
Why I test both desktop and mobile
Mobile and desktop can behave differently — especially on pages built with builders or heavy media. Google uses mobile-first indexing, and many users browse on phones, so testing both helps spot platform-specific problems.
How I interpret PageSpeed scores (simple guide)
- 90–100 = Excellent — strong baseline performance.
- 75–89 = Good — acceptable but may need tweaks.
- Below 75 = Concerning — likely to hurt UX and SEO unless improved.
Common mistakes I avoid
- Expecting Field Data on a brand-new test site: it won’t exist until the site is indexed and gets traffic.
- Testing only desktop or only mobile: missing platform-specific issues.
- Testing with cache enabled: gives falsely high scores.
- Focusing on one metric alone: I read LCP, TBT and CLS together — they tell the real story.
Practical note
I rely on Lab Data because my test sites are fresh and not indexed, so Field Data doesn’t exist. For controlled hosting comparisons, synthetic testing is actually preferred, since it keeps conditions identical across all providers.
Tool 3 — Pingdom (Load Time & Real-World Delivery)
Why I use it
Pingdom helps me understand how a full page loads from start to finish.
While tools like GTmetrix and PageSpeed focus on Core Web Vitals, Pingdom is better for measuring total load time, page weight, and request behavior.
It also provides a simple A–F performance grade, which makes host-to-host comparisons easy to understand at a glance.
What Pingdom measures
- Load Time – total time for the entire page to finish loading
- Page Size – total data downloaded
- HTTP Requests – number of files the browser must fetch
- Performance Grade – A to F score
- Waterfall chart – visual timeline of every request
My exact settings
- Location: Default Pingdom test server
- Connection: Default throttling profile (realistic user speed)
- Browser: Latest Chrome
- Runs: 2–3 tests per host
- Consistency: Same settings every time
Why I use the default location and connection
Instead of constantly switching regions or connection types, I keep Pingdom’s defaults.
This approach:
- reflects a typical real-world user
- keeps testing simple and repeatable
- makes it easier for readers to replicate results
- ensures fair comparisons between hosts
While a local data center may be faster for a reader in that region, my standardized locations provide a consistent benchmark so you can compare server capability across providers rather than measure geo-specific latency.
For benchmarking, consistency matters more than chasing the “perfect” location.
How I interpret the grades
- A (90–100) → Excellent
- B (80–89) → Good
- C or below → Concerning
If a host repeatedly scores C or worse, it usually indicates slow delivery or inefficient resource handling.
What the waterfall reveals
The waterfall chart shows details that scores alone can’t:
- which elements load first or last
- server response time (TTFB – measures the latency between the request and the first byte returned by the server. It directly reflects backend responsiveness.)
- blocking scripts or third-party tools
- oversized images or unoptimized assets
This helps me identify whether delays come from server performance or page resources.
Common mistakes I avoid
- Testing only once
- Looking only at the letter grade
- Changing locations or connection profiles mid-test
- Ignoring the waterfall details
Tool 4 — UptimeRobot (Reliability & Stability Monitoring)
Why I use it
Speed is only half the story.
A host can be fast but still unreliable.
If your site goes down frequently, visitors and search engines can’t access it — which hurts trust and SEO.
UptimeRobot helps me measure long-term stability, not just speed.
What it measures
- Uptime percentage – how often the site stays online
- Response time – server reaction speed
- Downtime incidents – when outages happen and how long they last
- Trends over time – consistency or instability
My exact settings
- Monitoring interval: Every 5 minutes
- Checks per day: 288
- Monitor type: HTTP(s)
- Duration: Minimum 25 to 27 days per host
- Target uptime: 99.9% or higher
Why 5-minute checks
Five minutes is a good balance because it:
- catches short outages
- matches common production standards
- avoids excessive server load
Longer intervals (15–30 minutes) can miss brief downtime completely.
How I interpret uptime
- 99.99% → Excellent
- 99.95% → Very good
- 99.9% → Acceptable
- Below 99.9% → Reliability concerns
Even small drops can mean hours of downtime over a year.
Common mistakes I avoid
- Monitoring for only a few days
- Starting monitoring late
- Looking only at uptime % and ignoring response time trends
Bottom line
Speed tests show how fast a host is.
Uptime monitoring shows how dependable it is.
I evaluate both — because a good host must be fast and reliable.
How I Access and Test Each Hosting Provider
Before running any performance tests, I make sure I’m working with a real customer environment, not demo or specially optimized review servers.
For every host, I either:
- purchase a plan myself
or - receive temporary full access to a standard customer account for evaluation
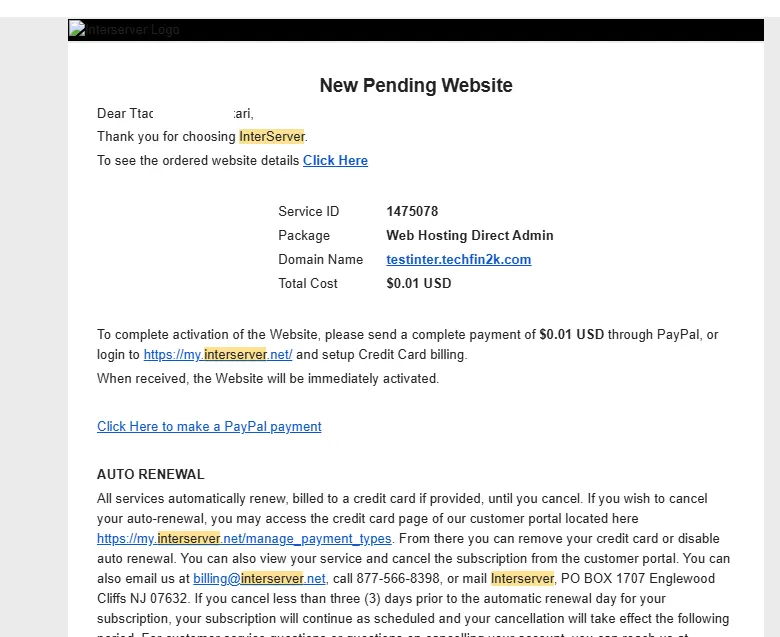
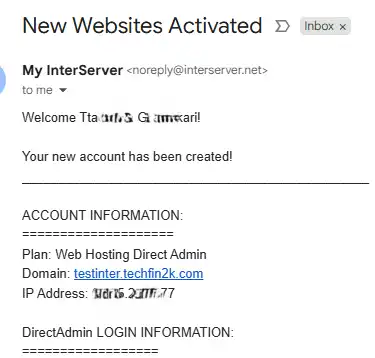
Note: These screenshots confirm that testing is performed on real customer accounts rather than demo servers, ensuring results reflect actual real-world performance.
In both cases, the account is identical to what regular customers use — same servers, same resources, and no special optimizations.
For full transparency, individual review articles may include invoices or account proof screenshots to show that testing was done on a real environment.
This ensures all results reflect actual real-world performance, not demo benchmarks.
With real hosting access confirmed, I move into a controlled, multi-phase testing process designed to measure speed, load handling, and reliability.
How I Test Web Hosting Performance: My Three-Phase Methodology
I test every host progressively so I can see how it behaves under different, realistic conditions. Each phase has a specific goal: measure raw server capability, observe real-site behavior, and verify stability over time.
The first step is to measure the server’s raw performance with a completely clean WordPress installation.
Phase 1 — Blank Site Baseline (Days 1–7)
I begin by testing the hosting environment in its purest form — a fresh WordPress installation with no plugins, no content, and no optimizations. This isolates the server and reveals its raw performance, creating a clean baseline for all later comparisons.
Exact setup
- Fresh WordPress install (latest version)
- Default theme (Twenty Twenty-Five or equivalent)
- No plugins
- No content (homepage only)
- No caching, CDN, or optimization applied
Testing schedule:
- Day 1: Install WordPress
- Day 2: Run 3 × GTmetrix tests (average results)
- Day 2: Run 3 × PageSpeed tests (desktop + mobile)
- Day 2: Run 3 × Pingdom tests (Default Pingdom location)
- Day 3: Spot-check — repeat a test to verify consistency
- Days 4–7: Passive UptimeRobot monitoring
Expected results for quality shared hosting
- GTmetrix LCP: 300–900 ms
- PageSpeed Desktop: 90–98
- PageSpeed Mobile: 85–95
- Pingdom Grade: A (90+)
- Uptime: ≥ 99.95%
Red flags
- LCP > 2 s — Why it’s a red flag: on a blank site this indicates server-level slowness. If an empty site can’t deliver the main content quickly, it will almost certainly slow dramatically once you add a page builder, images, and plugins.
- PageSpeed < 75 (structural or server problem)
- Pingdom Grade C or lower
- Response time consistently > 500 ms
- Any downtime incidents during baseline
Phase 2 — Real-World Load Testing (Days 8–21)
Purpose: Measure how the hosting performs when the site looks and behaves like a real WordPress site.
What I add
- Content: 10–15 posts (1,500–2,000+ words)
- Images: 20–30 images, ~100–150 KB each
- Homepage: typical layout with featured posts / widgets
- Plugins: standard stack to reflect real usage
- Yoast SEO (or RankMath)
- Elementor (Free)
- Akismet
- Jetpack
- WP Rocket or the host’s recommended caching plugin
- WooCommerce
These plugins mirror typical sites and reveal whether a host scales under moderate, realistic load.
Testing schedule:
- Day 8: Add content and plugins
- Day 9: Let plugins and cache stabilize
- Day 10: Run 3 × GTmetrix tests
- Day 10: Run 3 × PageSpeed tests
- Day 10: Run 2 × Pingdom tests
- Days 11–14: Spot checks to confirm consistency
- Days 15–21: Passive monitoring continues
What I analyze
- Relative performance degradation vs baseline (expected: 10–30% slower)
- Whether response times remain stable
- New uptime or availability issues
- Whether third-party scripts or large assets are the bottleneck
Expected changes vs baseline
- LCP usually increases 10–30% (normal)
- PageSpeed scores drop 5–10 points (normal overhead)
- >50% performance drop = red flag for server resource limits
Phase 3 — Extended Stability Monitoring (Days 22–27)
Purpose: Confirm consistency over time and detect periodic issues.
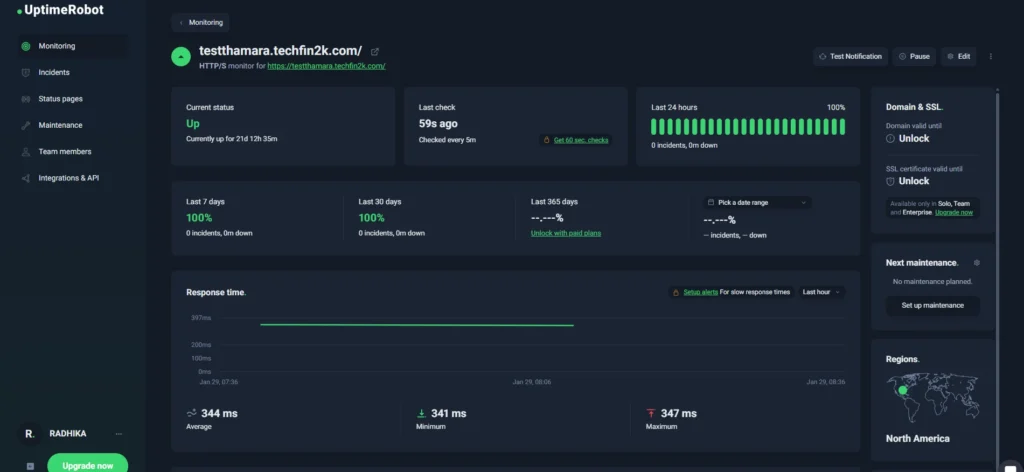
What I monitor
- Daily spot check: 1 GTmetrix test per day
- Continuous UptimeRobot monitoring (5-minute checks)
- Any customer support interactions and their resolution time
- Server resource usage logs (when available)
Why 27 days
One-day tests are noise. A 27-day window exposes patterns: scheduled backups, maintenance windows, daily resource spikes, or intermittent instability.
Why different tools show different numbers (short explanation)
Here’s the same URL tested in two different tools at nearly the same time.
GTmetrix focuses on Core Web Vitals and server responsiveness, while Pingdom measures total page load time and requests.
Because they test differently, the numbers vary — and that’s completely normal.
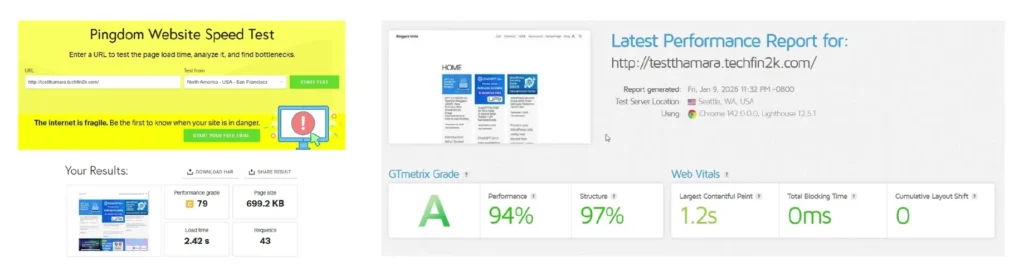
Different testing tools measure different things — so it’s normal to see varying numbers.
| Focus | GTmetrix | PageSpeed | Pingdom |
|---|---|---|---|
| Primary | Core Web Vitals + waterfall | Google ranking signals (Lighthouse) | Total load time & delivery |
| Typical config | Unthrottled / desktop (Default location) | Desktop + Mobile lab tests | Throttled mobile (Default location) |
| Emphasis | LCP, TBT, CLS | LCP, TBT, CLS, SEO checks | Full page load time, HTTP requests |
Note: You can verify these results yourself using the same tools. Google PageSpeed Insights is completely free and requires no login, while GTmetrix and Pingdom offer free basic tests with some limits. Running the same checks on your own site makes it easy to compare performance directly.
What I watch for
- Consistency within each tool (e.g., GTmetrix results should be similar run-to-run).
- Proportional differences across tools (Host A faster than Host B across tools).
- No major red flags — if one tool reports extreme problems while others are fine, investigate the cause.
My testing standards (to keep data trustworthy)
Sample size
- Minimum 3 tests per tool, per phase. Average the results; run a 4th test if there is an outlier.
Timeframe
- Minimum 27 days of testing per host to capture patterns and reliability.
Error margin
- Acceptable variance: ±10% between successive tests.
- Red flag variance: >25% → re-run and investigate.
Location standard
- Use the same test locations for each tool (GTmetrix: Default Pingdom location; Pingdom: Default Pingdom location). Note location exceptions when testing specific regions.
When I discard data
I discard results if:
- there was an obvious network issue (spike well outside normal range),
- the server was down (confirmed by UptimeRobot),
- I failed to follow the standard settings, or
- something changed mid-test (plugin/theme update, DNS change).
Comparative standard
All hosts are tested identically: same WordPress version, same plugins, same content, same Testing schedule. If tests occur in different months, I keep software versions and test parameters identical so comparisons remain fair.
Summary — what this process gives you
A fair, repeatable, and reproducible hosting benchmark that reflects real-world WordPress use:
- Baseline reveals raw server strength.
- Load testing shows how the host performs under normal site conditions.
- Extended monitoring confirms reliability over time.
How I Test Customer Support (The Human Factor)
Speed and uptime can be measured with tools, but customer support is different.
Since support quality can make or break your experience, I test it using a structured and repeatable process rather than relying on personal opinions.
The Three-Query Method
For every hosting provider, I contact support with three types of questions:
- Basic question — simple setup or beginner issue
- Technical question — deeper WordPress/server configuration problem
- Billing question — refund, cancellation, or policy clarification
This shows how well they handle both new users and advanced customers.
What I measure
During each interaction, I record:
- Response time — how long it takes to get a reply
- Technical depth — whether the answer is actually helpful or copy-paste
- Clarity — easy to understand or confusing
- Resolution rate — problem solved or escalated
- Upselling behavior — do they help first or try to sell something?
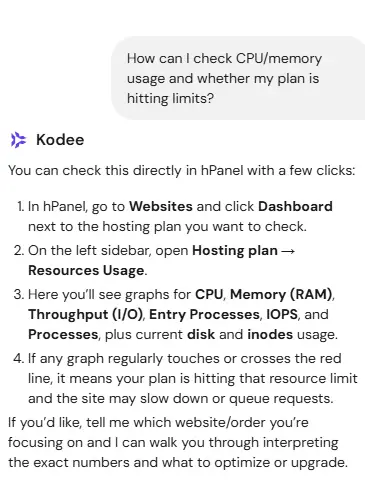
Example support interaction during testing. I asked how to monitor server resource limits, and support provided clear steps inside hPanel along with guidance on interpreting CPU, memory, and I/O usage.
Time-of-day testing
I contact support at different hours (both peak and off-peak times) to check staffing consistency.
Some hosts respond quickly during the day but slow down at night.
Reliable providers stay responsive 24/7.
Beyond structured test queries, I treat support interactions organically. Whenever I run into real setup or configuration problems during testing — migrations, SSL provisioning, DNS issues, or WordPress errors — I contact support just as a normal customer would. This gives me a more accurate picture of real-world responsiveness.
This helps me evaluate how support performs in genuine, real-world situations rather than only scripted scenarios.
Why this matters
A host can be fast on benchmarks but frustrating in real life if support is slow or unhelpful.
That’s why support quality is included alongside speed and uptime in my final evaluation.
How I Use These Results in My Reviews
All the testing above provides raw data — speed metrics, uptime logs, and real support interactions.
I don’t convert this information into artificial scores or star ratings.
Instead, I present the actual numbers, screenshots, and observations directly inside each review so you can see the evidence yourself.
From there, I simply interpret what the data means in practical terms — whether the host feels fast, stays reliable over time, and provides helpful support when needed.
Based on the overall experience, I offer clear recommendations such as:
- Highly recommended
- Good for beginners
- Budget-friendly but limited
- Consider alternatives
This keeps reviews transparent and avoids misleading “scores” that hide important details behind a single number.
My goal is simple: show the facts first, then explain them — so you can decide with confidence.
Disclosure & Ethics
I test every hosting provider using real customer accounts and identical conditions.
Some links on this site are affiliate links, which means I may earn a commission if you choose to sign up — at no extra cost to you.
However, commissions do not influence my testing or conclusions.
All performance data comes directly from independent tools like GTmetrix, PageSpeed Insights, Pingdom, and UptimeRobot. These results are generated automatically and cannot be edited or adjusted.
No hosting company can pay for a higher ranking, remove negative results, or influence my recommendations.
If a host performs poorly, I publish those results exactly as recorded — even if it reduces affiliate earnings.
My approach is simple: test in real-world conditions, publish the data as it is, and explain the results honestly so you can make an informed decision.
This page explains exactly how I test hosting providers.
Where to See My Hosting Reviews
If you’d like to see the methodology applied in real-world conditions, you can explore my detailed reviews below. Each one includes actual speed reports, uptime logs, screenshots, and hands-on testing data collected using the same process described here.
- InterServer Hosting Review
- Verpex Hosting Review
- InMotion Hosting Review
- Thamara Cloud Hosting Review
- Hostinger Hosting Review
These reviews follow identical testing conditions so you can compare results fairly and choose the provider that fits your needs.
FAQ — Common Questions About My Testing Method
Why don’t you test with caching plugins enabled?
Because I measure raw hosting performance, not optimization tools. Caching is something you add later. My goal is to establish the server’s baseline capability first.
Why use both GTmetrix and PageSpeed Insights?
They measure performance differently. GTmetrix focuses on Core Web Vitals and detailed diagnostics, while PageSpeed reflects Google’s ranking signals. Using both gives a more complete picture.
What if I use different plugins or themes?
Results will vary. Poorly coded plugins or heavy themes can slow any hosting. That’s why I test all providers under identical, controlled conditions.
Why are my speed results different from yours?
Performance can vary due to location, time of day, caching, network conditions, or installed plugins. That’s why I run multiple tests and average the results.
How often do you retest hosting providers?
I retest when infrastructure changes are announced or periodically to check for long-term consistency. Reviews always show the publication or update date.
Do affiliate commissions influence your reviews?
No. All speed and uptime data comes directly from independent testing tools and cannot be edited. Results are published as recorded.
Final Thoughts
Reliable hosting reviews should be based on data, not marketing claims.
By testing every provider under identical conditions and sharing the exact process openly, I aim to give you clear, verifiable results you can trust.
If you’d like to see this methodology applied to real providers, explore the reviews linked above.

One Comment